The semester is over and two successful batches have taken place; The Cassiopeia Pale Ale and the Electric Lady Belgium Blonde. This semester consisted of testing out our fermenter and getting familiar with brewing. We have set up the framework for our application and are taking temperature readings and posting them to a webpage. We have also incorporated a pH sensor into our board and will be testing it further in the New Year.
Now that two successful brews have taking place we can begin to compare and contrast the different styles and typical overall observations. First, let’s clear up some abbreviations and brewing lingo.
Wort: The infusion of malt or grains with water to produce beer
OG and FG: OG (Original Gravity) and FG (Final Gravity) are specific gravity measurements that we obtain using a hydrometer. This measures the specific gravity of the beer. Because wort has extracted the sugars from the grains or malt the specific gravity of the wort is greater than that of water. As the yeast eats the sugars from the beer the density is reduced due to the reduction of sugars and the production of ethanol, which has a specific gravity of 0.789 at room temperature.
ABV: Alcohol by volume. This is essentially the milliliters of ethanol per hundred millilitres solution. It is calculated by the following formula: ABV = 133.62*(OG-FG)
SRM: Standard Reference Method. It references the reduction in light flux intensity at 430 nm per 1 cm of beer.
IBU: International bitterness unit. The bitterness comes from the alpha acids in the hops of beer. IBU measures the amount of alpha acids in the beer rather than the perceived bitterness. For example, a beer with a stronger flavor profile and a higher amount of alpha acids could taste less bitter than a beer with a weaker flavor profile and a lower amount of alpha acids.
Sparging: The process of which hot water is pour over the grains to capture any sugars.
Table 1: Measured Densities and Calculated SRM and IBU
| Style | OG | FG | ABV | Calculated SRM | Calculated IBU |
|---|---|---|---|---|---|
| Pale Ale | 1.0375 | 1.010 | 3.7% | 12 | 32.23 |
| Belgian Blonde | 1.039 | 1.010 | 4.59% | 6 | 25.51 |
Table 1 shows the measured and calculated values for the recipes. Table 2 shows typical values for a American Pale Ale and a Belgium Blonde. Immediately you can see that the ABV (Alcohol by volume) values are lower than what is typical for both beers. This is due to low OG in each of the beers. The Pale Ale was a centennial style brew which uses both grains and malt. The grains were not properly sparged and the process was rushed. During the brewing of the belgian blonde we went through a much lengthier sparging process but the lack of malt did still resulted in a low OG. Typical homebrewers tell you to sparge for approximately an hour and made it quite clear not to rush this process. Brewing during midterms however forced our hand and we only sparged for approximately 30 minutes. Let us reiterate: DO NOT RUSH THE SPARGING PROCESS.
For future reference we will not rush the sparging process. A new hot plate and boiling kettle will also allow us to heat the water to a higher point which will capture more sugars from the grains.
Both SRM’s fall within the expected range for their typical styles. SRM’s are a result of the type of grains and also have a correlation with brewing pH which is currently being researched with data analysis. We have just built the pH sensor into our system and will be measuring the pH of the brew water before brewing begins and the pH of the beer after fermentation. Some in-process measurements may be taking for kinetic purposes. Both calculated SRMs come from this calculator: https://www.brewersfriend.com/srm-calculator/
The bitterness comes from the alpha acids in the hops of beer. IBU measures the amount of alpha acids in the beer rather than the perceived bitterness. For example, a beer with a stronger flavor profile and a higher amount of alpha acids could taste less bitter than a beer with a weaker flavor profile and a lower amount of alpha acids. Both calculated IBUs land in the range. Using a spectrophotometer we will be measuring the actual values of these beers in the New Year. Calculated IBU’s come from this calculator: https://www.brewersfriend.com/ibu-calculator/
Table 2: Typical Gravities, ABV’s, SRM’s and IBU’s
| Style | OG | FG | ABV | Calculated SRM | Calculated IBU |
|---|---|---|---|---|---|
| Pale Ale | 1.045 - 1.060 | 1.010-1.015 | 4.5-6.2% | 5-14 | 30 - 45 |
| Belgian Blonde | 1.062 - 1.075 | 1.008-1.018 | 6.0-7.5% | 4-7 | 15 - 30 |
Part of our project is tracking temperature to better model the kinetics during fermentation. The temperature graphs help brewers who do not have temperature control monitor the changes in temperature over time and how the temperature fluctuation in the room effects the brew. Attached is our temperature log from our Electric Lady Belgian Blonde.
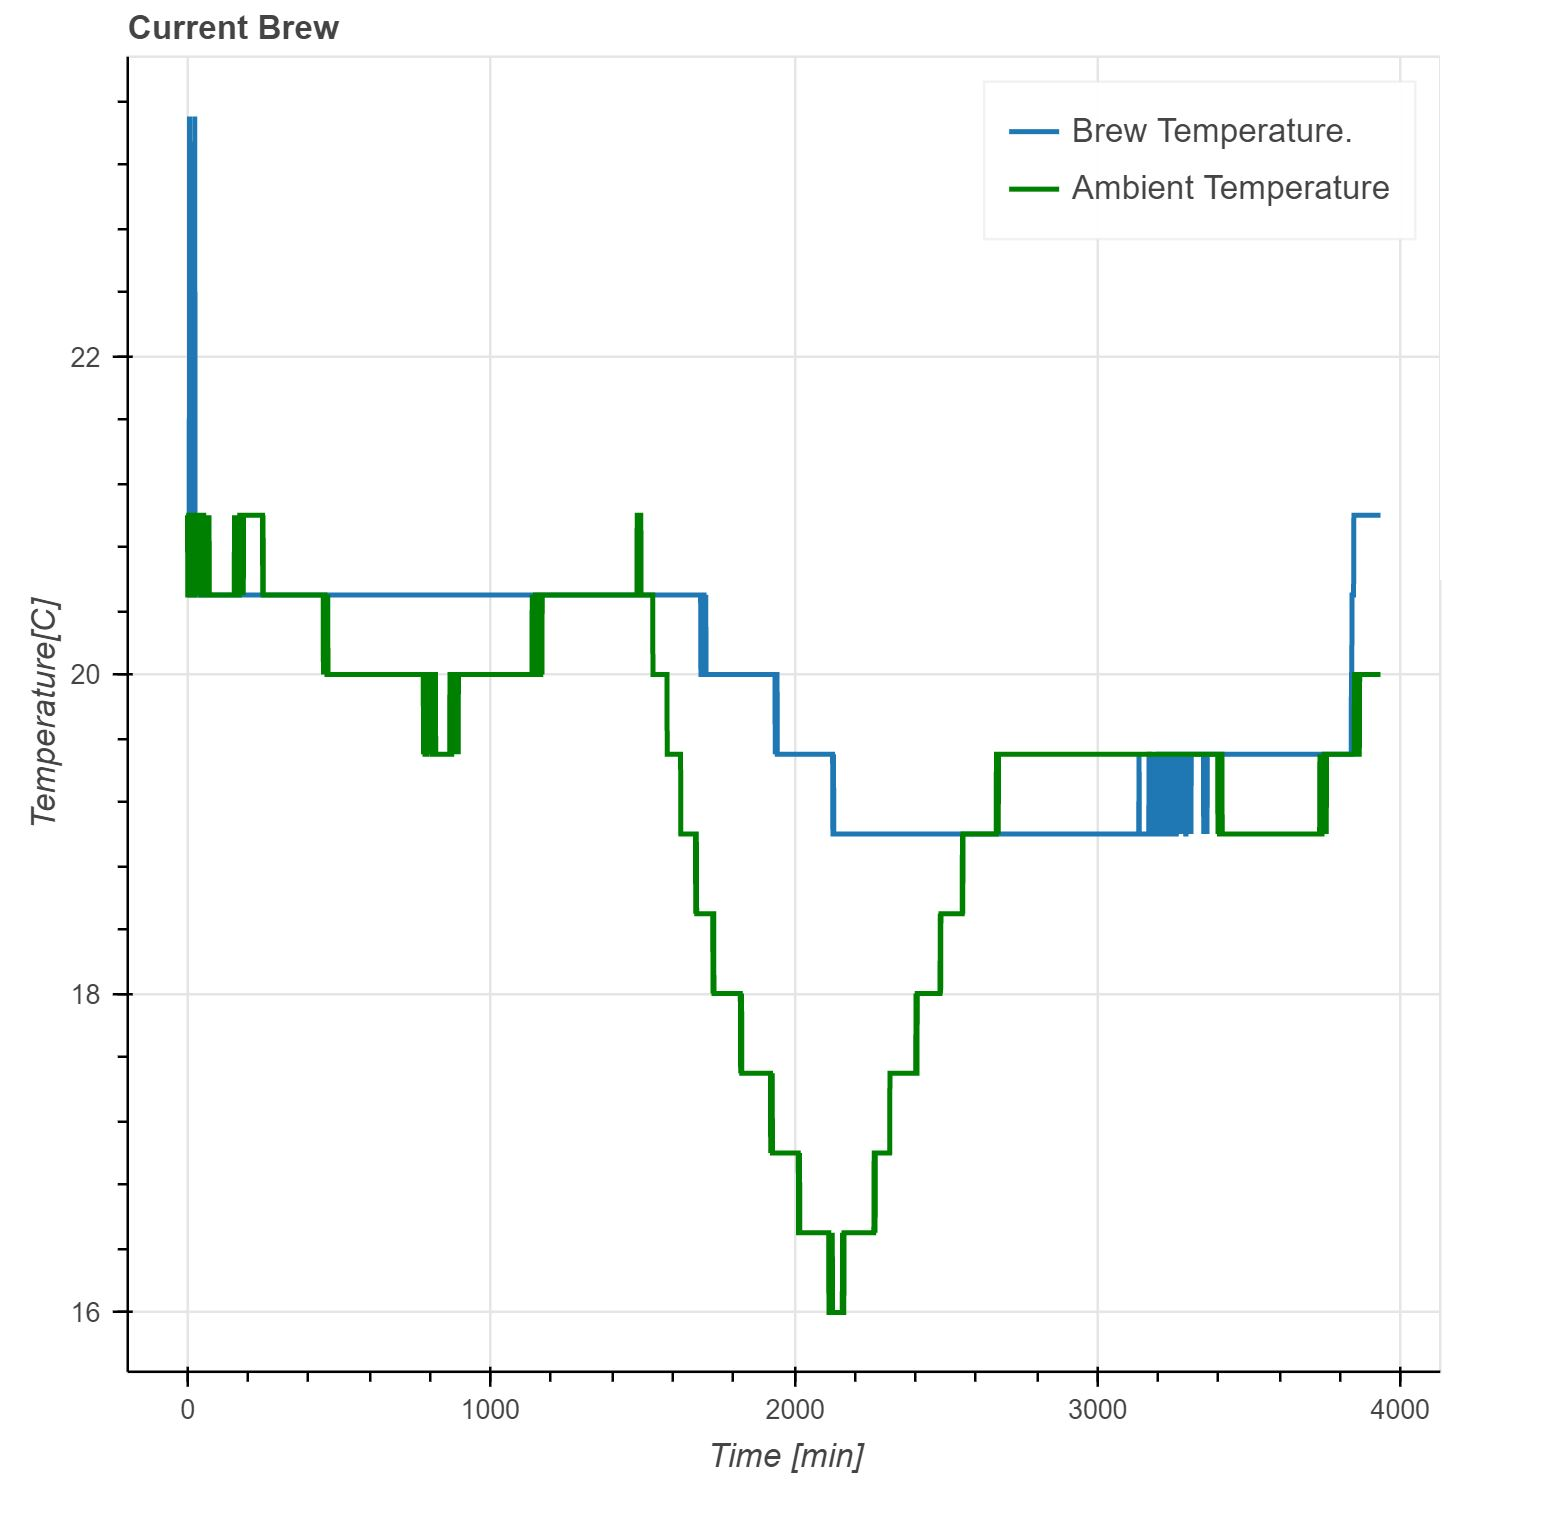
This graph shows fluctuations in the ambient temperature while the beer stays at a relatively high temperature due to the high specific heat capacity of water and production of heat from the yeast. Ideal temperature for this beer were between 17 and 19 degrees Celsius. In the beginning of the brew there is a period of time where the brew temperature is approximately 20.5 degrees Celsius. We would have reduced the brew temperature but we did not have temperature control for this brew at this time. We will be incorporating a CO2 capture system into the fermenter and by comparing temperature trends to the carbon dioxide that is being produced we can analyze the reaction kinetics. We have temperature control now and can test carbon dioxide production rates at various temperatures. Capturing the CO2 will also allow us to look into pressurizing it and injecting it back into the beer for force carbonation, if we started kegging our beer. This could be great to look into as a “zero emissions soda stream” but a proper economic analysis has not been carried out at this time to look into its viability or if the amount of carbon dioxide is even enough carbonate the beer. Currently we use natural carbonation with utilizes the yeast and priming sugar. This means we cannot filter our beer – which is not ideal. Typical breweries force carbonate their beer using an industrial system as they use centrifugation to separate yeast and grains from the beer.
Home brewers typically allow grains to settle as the yeast will float for as long as it is active. We prepared a settling test to have a better idea what is going on in the fermenter after fermentation is complete. We had many questions. How long does it actually take for these particles to settle? What is the average particle size?
We borrowed the settling apparatus from the undergraduate laboratories (Thanks to Ken Wong and Dhanesh Kannangara). Once allowed to settle four layers appeared with clear interfaces between zone settling. We did not measure the time it took to settle into these different zones but will be taking a time lapse with video cameras of the settling in the New Year. Zone 1: Little to no particulates are observed in this zone. A TSS (Total suspended solids) test would be ideal to see how many particles are suspended. GC-MS analysis could be a good idea to give us an overview of what is in the produced beer. Some yeast is observed still floating on the top of the fluid. Is it still alive? Is the tube not completely air tight? BOD tests are needed to characterize this and explain. A BOD test will also give us an idea for the initial yeast kinetics when it is using oxygen as a substrate rather than sugar. Zone 2: Slightly more cloudy. This zone would be best filtered. Zone 3: Large grain particles not caught by false bottom.
Now that we have tested our fermenter and are better set up with more brewing experience, more equipment and instrumentation we are ready to begin the analysis of our beer. In the New Year we will be running GC-MS samples, measuring the SRM, IBU, and turbidity of the beer as well as developing more units which will contribute to our home brewing setup. Once we have the numbers gathered from a few brews we will be able to begin to apply machine learning to produce better beer that fits within specific style characteristics. Keep posted for part two where we discuss settling times, pictures, particle characterization and some other analysis of IBU, SRM and diacetyl. Further brewing will result in more data collection and better beer!
Happy Holidays and a Happy New Year!